(under construction -- remnants here need to be edited)
Data on deaths of unknown age is available for 1903-1955 only. These deaths were distributed proportionately across the age range.
For 1899-1902, 1934, 1935, and 1947, we have only the number of deaths above age 100. These deaths are split among ages and triangles arbitrarily.
Raw data, age 100+:
|
|
Type of 100+ category * |
Males |
Females |
|
1899 |
1 |
20 |
59 |
|
1900 |
1 |
114 |
144 |
|
1901 |
1 |
23 |
51 |
|
1902 |
1 |
20 |
56 |
|
1934 |
2 |
3 |
24 |
|
1935 |
3 |
26 |
85 |
|
1947 |
1 |
17 |
53 |
note: There are three types of 100+ categories:
1 = age 100, upper triangle and above
2 = exact age 100 and above
3 = age 99, upper triangle and above
Estimating January 1 Population
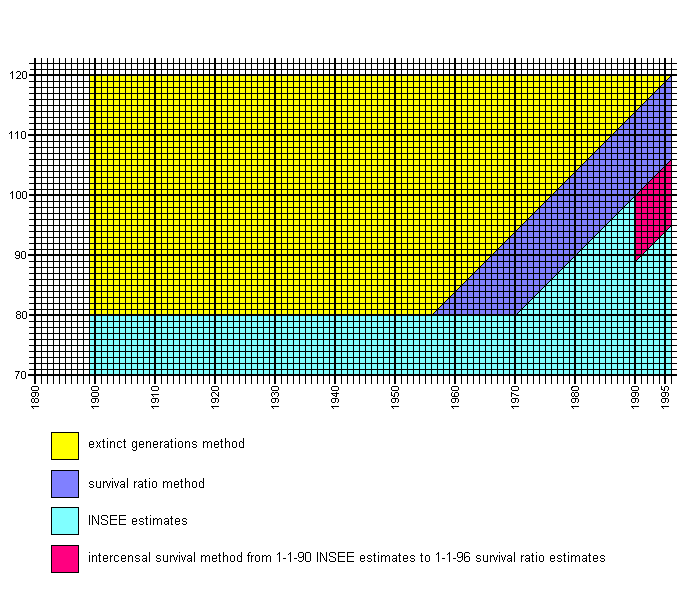
January 1 population estimates below age 80 are taken from INSEE. For cohorts which have reached age 119 by 1995, deaths are cumulated backwards using the method of extinct generations to obtain population estimates for ages 80 and above. For cohorts aged 105 to 118 in 1995, population counts for ages 80 and above are estimated using the survival ratio method. For cohorts aged 95 to 105 in 1996, the intercensal survival method is used, taking the 1996 survival ratio estimates for these cohorts as the ending population, and the 1990 census counts as the beginning population. All other figures are taken from INSEE.
The method of extinct generations is complicated by the fact that there were several territorial changes during World War I and World War II, and the population figures given by INSEE correspond to different numbers of departments in different time periods. In order to use the method of extinct cohorts, we first adjust all deaths to correspond to the maximum number of departments over the entire time period (90 departments). Next we cumulate deaths backwards using the adjusted deaths to get January 1 population estimates. Finally, these estimates are multiplied by an adjustment factor to convert them back to the actual number of departments in each time period.
Note: When two sets of population estimates are given for the same year, the first corresponds to the estimated population before a territorial change, and the second corresponds to the estimated population after a territorial change.